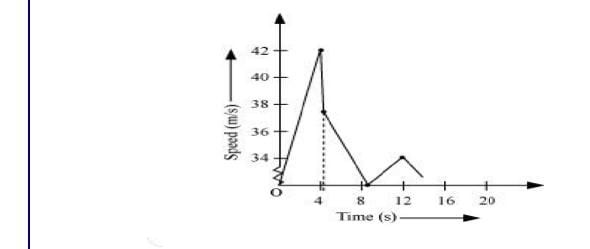
A ball is dropped from a height of \(90~\text m\) on a floor. At each collision with the floor, the ball loses one-tenth of its speed. Plot the speed-time graph of its motion between \(t=0\) to \(12~\text s.\)
| 1. |  |
2. |  |
| 3. |  |
4. |  |
Taking vertical downward motion of ball from a height 90 m, we have
The speed-time graph of the ball is represented in the given figure as:
© 2026 GoodEd Technologies Pvt. Ltd.

